Find Breakout Trades in Choppy Markets

(5 minute read)
HOW TO AVOID SIDEWAYS MARKETS AND PREPARE FOR BREAKOUT TRADE ENTRIES
Most traders get chewed up by choppy market conditions like a old soggy dog bone.
You're not alone. Very few traders are consistently successful in range restricted market conditions.
The biggest problem is not recognizing these conditions until it's too late so you need a way to anticipate these conditions BEFORE you're in it.
Using Volume Profile (TAS Market Map™ charting indicator) allows you to clearly see the congestion zones in advance so you can avoid the chop. Even better, you'll be able to pinpoint prime entry points into your next trade when the market finally breaks out of these challenging PNL-crushing zones. This article will teach you a simple technique to seeing sideways market zones and how to prepare entries when the market begins to move vertically again.
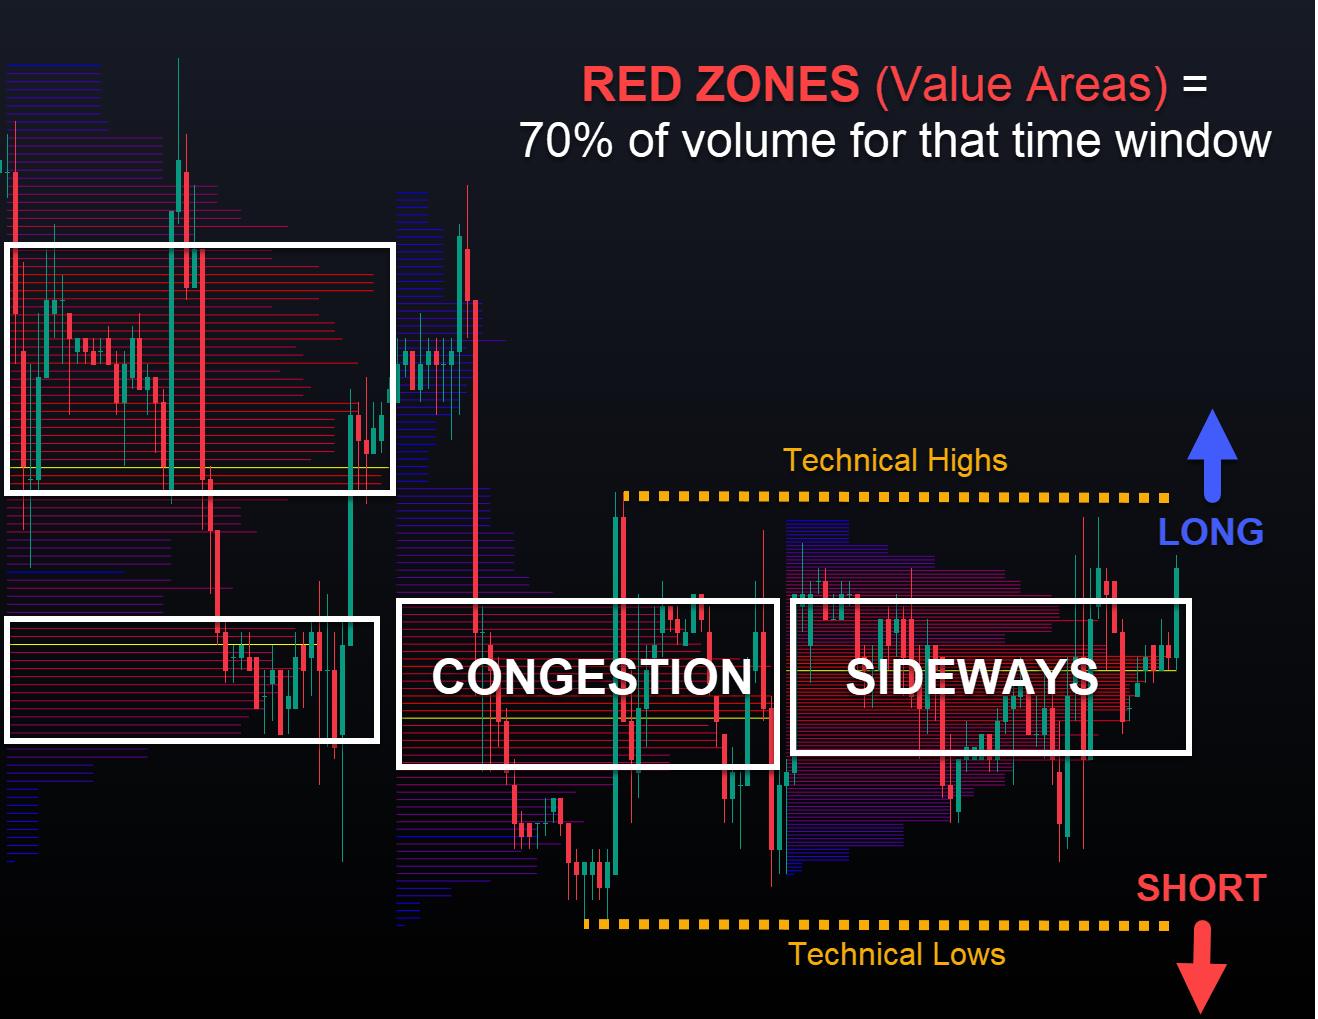
Let's walk through the example chart below together.

TAS Market Map™ can be placed on your chart as a single instance or multiple time windows as shown. In either case, you'll glean valuable information to know where the most volume is accumulating on the chart. You'll see the white rectangles highlight the red-colored zones known as Value Areas and these areas comprise approximately 70% of the volume that has occurred for those corresponding time periods on the chart. This chart has the TAS Market Map every 50 bar increments.
Why is this valuable to know?
Think of it like a highway and the value areas (red zones) are those areas where there's a lot of traffic that is moving slow. Would you want to get on the on-ramp to the highway at those congested areas or would you prefer to enter on the other side of all the traffic? Obviously, if you could clearly see those congestion areas you'd wait until there was a clear path of "open highway" before entering the trade.
Now you're getting the hang of it.
THE RULES ARE SIMPLE:
- Enter LONG when the market breaks above the value area
- Enter SHORT when the market breaks BELOW the value area
BUT YOU SHOULD INCLUDE AWARENESS OF RECENT TECHNICAL HIGHS AND LOWS TOO:
If you add the criteria for entry to include breaking recent technical highs (resistance) and technical lows (support), this improves the probability of market follow through. You'll see where the LONG signal would be highlighted on the chart with the blue arrow and the SHORT signal where the red arrow resides. It comes at the expense of a less advantageous entry price BUT you may avoid false breakouts altogether in markets that only tease outside the value areas as you can see on the chart. Over the course of a trading year, staying out of avoidable losing trades by making the market work harder to earn your risk dollars really do add up.
See that wasn't too complicated! You just learned a simple technique to be aware of congested sideways markets so you can avoid the chop and instead prepare a prudent breakout entry opportunity. That's how you can use choppy markets to your advantage but remember, you have to be disciplined and patient to consistently deploy this tactic. Thankfully, I know you can do it!
Happy Trading,

P.S. Remember, you're just one trade away...
Don't Miss Our FREE Trading Lessons!
We'll email you when new trading videos and articles are posted.
We don't spam or sell your information. That's just not cool.

